ReportGuru
What is ReportGuru?
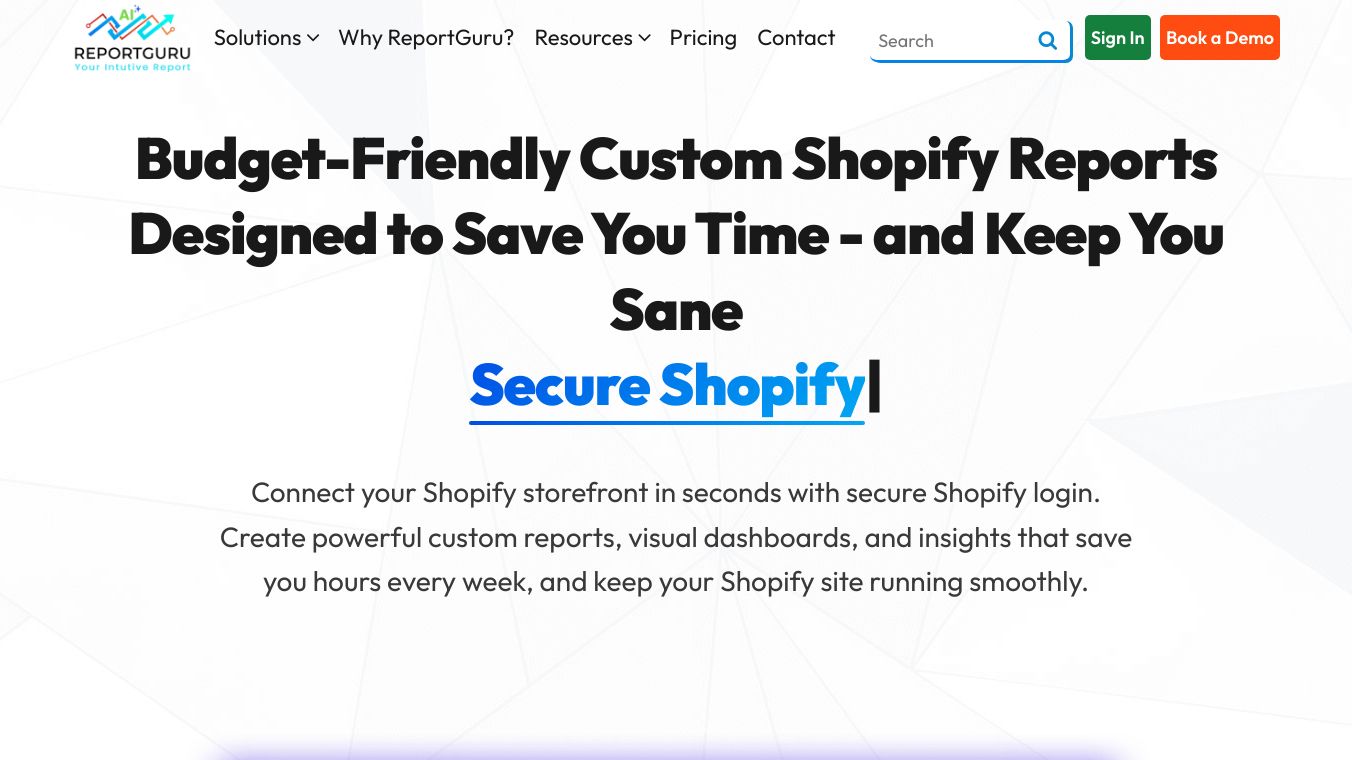
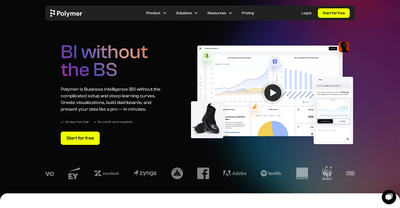
ReportGuru is a powerful tool designed to help businesses transform raw data into clear, interactive visuals. It moves beyond traditional spreadsheets by converting complex numbers into easy-to-understand charts and graphs. This allows users to quickly identify trends, spot growth opportunities, and monitor key performance metrics without sifting through endless rows of data.
Benefits
Dynamic Charts & Graphs
ReportGuru instantly turns raw data into dynamic charts and graphs. This makes it easy to see sales, inventory, and customer trends at a glance. Complex data becomes simple and accessible, helping users make informed decisions quickly.
Interactive Dashboards
With ReportGuru, users can explore their performance in real time. The interactive dashboards allow users to click into charts, drill down into details, and uncover patterns at a glance. This real-time exploration helps users stay on top of their business performance.
Instant Connection
ReportGuru connects seamlessly to your store. Once connected, your reports come alive with meaningful insights. This instant connection ensures that users always have the most up-to-date information at their fingertips.
Identify Trends Faster
Spot growth opportunities, track dips, and monitor key performance metrics with ease. ReportGuru helps users identify trends faster, allowing them to make smarter business decisions.
Use Cases
Business Performance Monitoring
ReportGuru is ideal for businesses looking to monitor their performance in real time. Whether you're tracking sales, inventory, or customer trends, ReportGuru provides the tools you need to stay informed and make data-driven decisions.
Data-Driven Decision Making
By transforming raw data into clear visuals, ReportGuru helps users make faster, smarter business decisions. The tool's interactive dashboards and dynamic charts make it easy to uncover insights and take action.
Shopify Store Optimization
ReportGuru is particularly useful for Shopify store owners. It allows users to access over 2,000 data fields, automate their reporting, and make informed decisions to drive business growth. With ReportGuru, users can maximize their store's performance and achieve their business goals.
Why Visualization Matters
Behind every number lies a bigger picture. ReportGuru presents your data in a clear, engaging, and actionable way. This helps users make faster, smarter business decisions. From raw data to visual clarity, ReportGuru brings your store's performance to life.
Create and Automate Your Shopify Reports
With ReportGuru, users can create and automate their Shopify reports. This saves time and ensures that users always have the most accurate and up-to-date information. By automating their reporting, users can focus on what matters most—growing their business.
This content is either user submitted or generated using AI technology (including, but not limited to, Google Gemini API, Llama, Grok, and Mistral), based on automated research and analysis of public data sources from search engines like DuckDuckGo, Google Search, and SearXNG, and directly from the tool's own website and with minimal to no human editing/review. THEJO AI is not affiliated with or endorsed by the AI tools or services mentioned. This is provided for informational and reference purposes only, is not an endorsement or official advice, and may contain inaccuracies or biases. Please verify details with original sources.


Comments
Please log in to post a comment.