Polymer
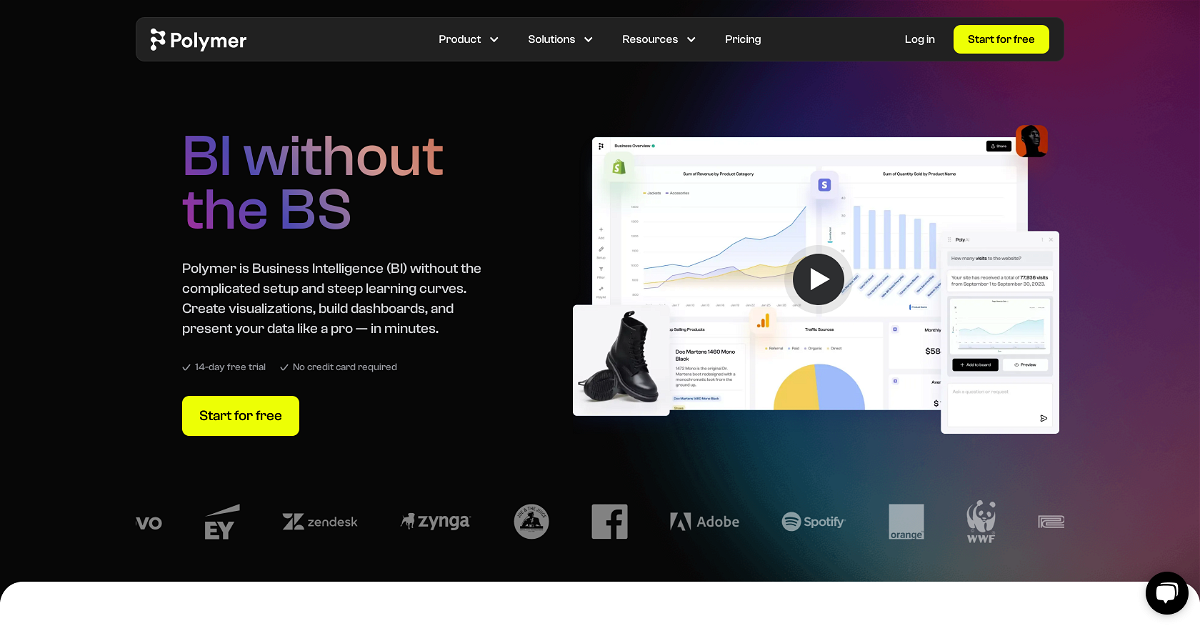
Polymer is a powerful yet user-friendly business intelligence tool that makes data visualization and analysis accessible to everyone, regardless of technical expertise. It allows users to create interactive dashboards and reports with ease, eliminating the need for complex setups and extensive training.
Highlights
- Effortless Data Visualization: Create stunning and informative dashboards without any coding or data analysis skills.
- AI-Powered Insights: Uncover hidden patterns and trends in your data with the help of AI, revealing answers to questions you didn't even know to ask.
- Collaborative Workspaces: Share dashboards, provide feedback, and set up recurring reports with your team, fostering seamless collaboration.
Key Features
- Embedded Analytics: Integrate charts and graphs directly into your existing applications and services for a seamless data experience.
- Pre-built Templates: Get started quickly with industry-specific templates for e-commerce, marketing, sales, and more.
- Wide Integrations: Connect with popular platforms like Shopify, Google Sheets, Facebook Ads, Google Analytics, Google Ads, and Salesforce to streamline your data workflow.
- Free for Educators and Students: Empower the next generation of data analysts with access to Polymer's powerful features at no cost.
This content is either user submitted or generated using AI technology (including, but not limited to, Google Gemini API, Llama, Grok, and Mistral), based on automated research and analysis of public data sources from search engines like DuckDuckGo, Google Search, and SearXNG, and directly from the tool's own website and with minimal to no human editing/review. THEJO AI is not affiliated with or endorsed by the AI tools or services mentioned. This is provided for informational and reference purposes only, is not an endorsement or official advice, and may contain inaccuracies or biases. Please verify details with original sources.


Comments
Please log in to post a comment.