GloGraph
GloGraph: Mapping Cause and Effect in Complex Systems
Overview
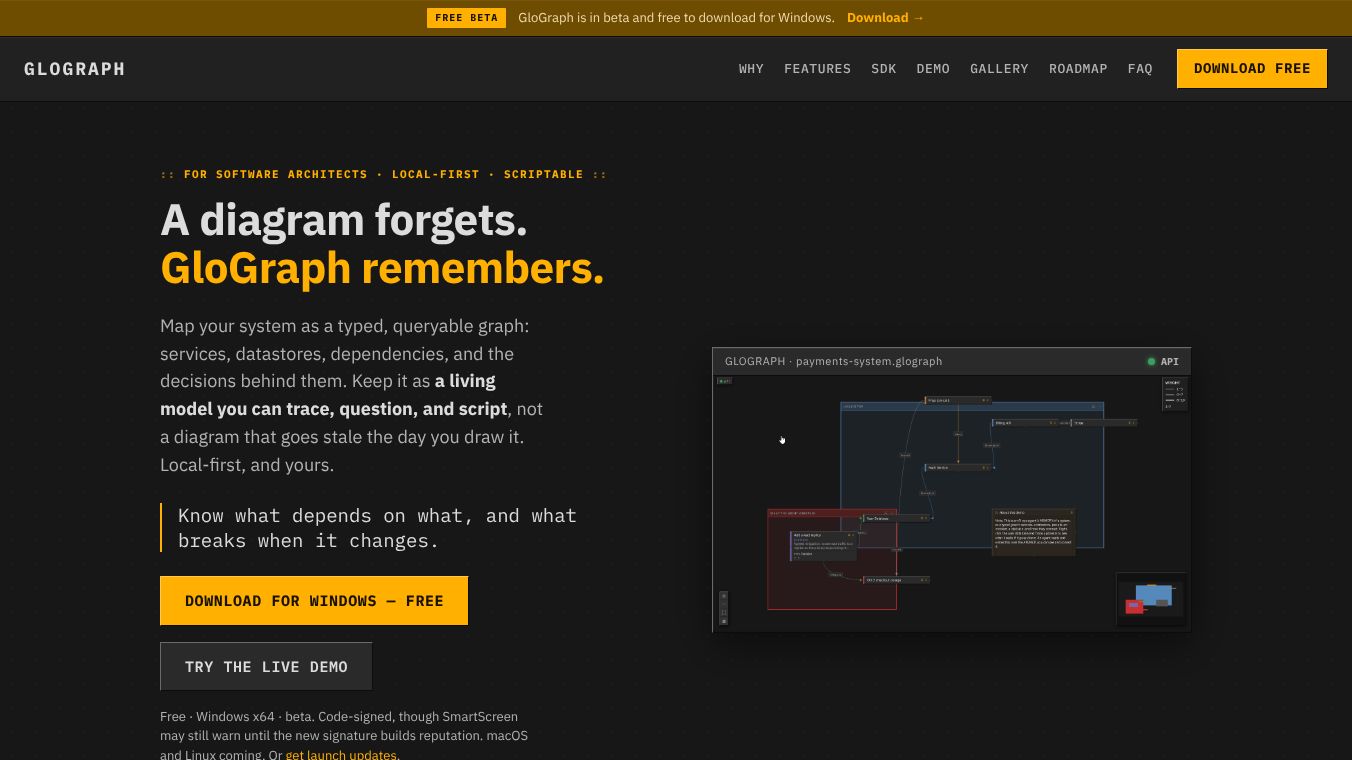
GloGraph is a tool designed to transform static diagrams into dynamic, usable structured data. It enables users to map cause-and-effect relationships within complex systems and architectures, turning visual representations into actionable intelligence.
Benefits
GloGraph offers several key advantages over traditional mapping tools. Unlike static pictures, it converts every map into structured data. This allows users to filter specific elements within the map, search through complex architectures efficiently, and trace back to root causes of issues. The tool operates on a local-first principle, ensuring that projects remain with the user regardless of internet connectivity. This setup maintains data privacy and removes the need for cloud-based storage for core project files. Additionally, the tool is designed to be programmable, enabling automation via scripts and integration with AI agents for automatic map building. Users can also create custom workflows tailored to their specific system analysis needs.
Use Cases
GloGraph is particularly valuable for system architects analyzing complex infrastructure. Engineers can use it to troubleshoot root causes in distributed systems. Teams can rely on it for documenting and maintaining knowledge of evolving architectures. Researchers can also use the tool to map causal relationships in complex datasets. By converting static diagrams into interactive, searchable, and programmable data, GloGraph empowers users to gain deeper insights into the systems they design and maintain.
Pricing
GloGraph is available as a one-time purchase. This model distinguishes it from subscription-based mapping tools and offers a cost-effective solution for organizations and individuals.
Vibes
The tool is positioned as a practical solution for those dealing with intricate system designs. It appeals to professionals who need more than just a pretty picture and require data they can actually use for analysis and automation.
Additional Information
While GloGraph focuses on structured system mapping, other tools in the ecosystem include Figmap, which uses AI for visualizing concepts, Diagrimo, which converts text into diagrams instantly, and MapKit, which enables embedding interactive maps in minutes.
This content is either user submitted or generated using AI technology (including, but not limited to, Google Gemini API, Llama, Grok, and Mistral), based on automated research and analysis of public data sources from search engines like DuckDuckGo, Google Search, and SearXNG, and directly from the tool's own website and with minimal to no human editing/review. THEJO AI is not affiliated with or endorsed by the AI tools or services mentioned. This is provided for informational and reference purposes only, is not an endorsement or official advice, and may contain inaccuracies or biases. Please verify details with original sources.


Comments
Please log in to post a comment.