ER Diagram
What is an ER Diagram?
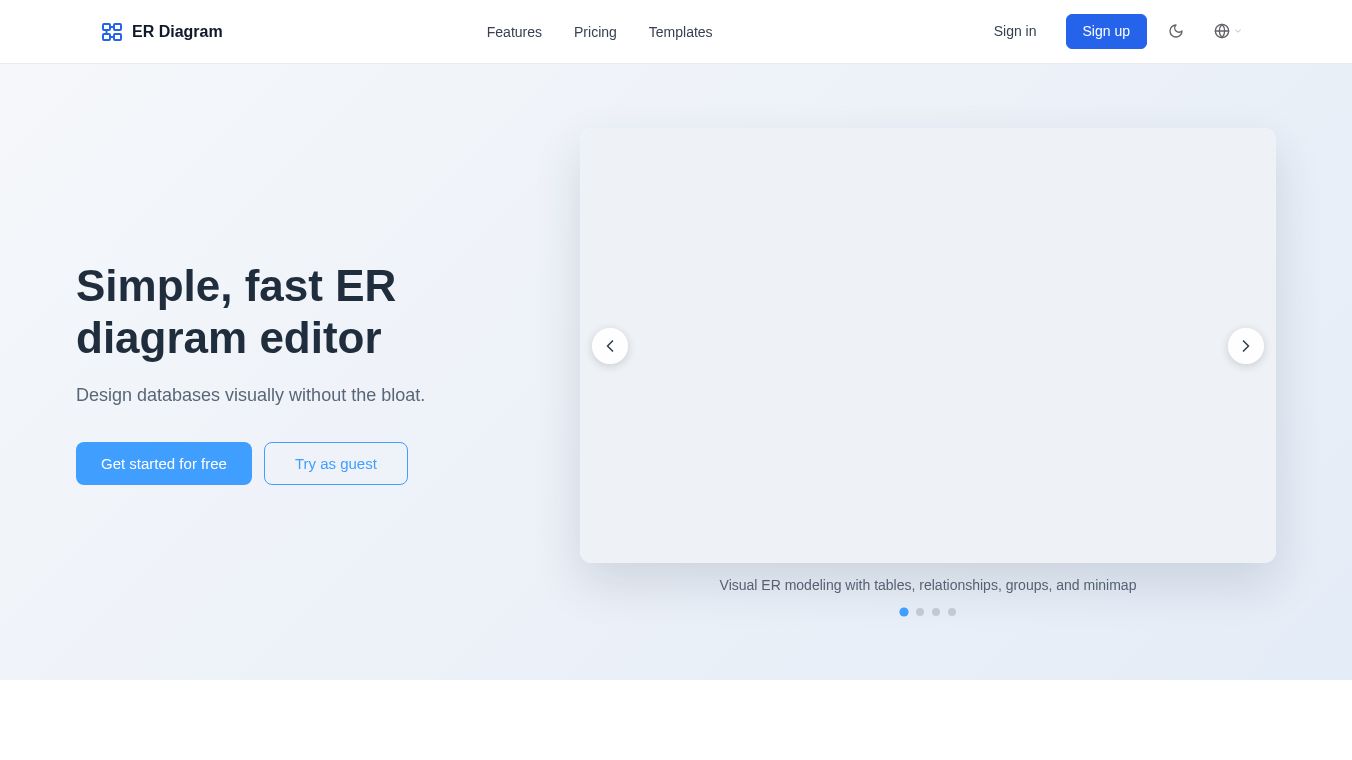
An ER Diagram, or Entity Relationship Diagram, is a visual tool used to design and understand databases. It acts like a map for data, showing how different pieces of information connect to one another. This tool helps people plan how to store data in a way that is organized and easy to use. It is a standard part of database design used by software developers and data analysts around the world.
Benefits
Using an ER Diagram offers several clear advantages for anyone working with data. First, it makes complex data structures easy to understand at a glance. Instead of reading long lists of rules, a person can look at a picture to see how tables relate to each other. This helps teams agree on a design before they start building the actual database. It also reduces mistakes because the plan is clear from the start. Finally, it serves as a great communication tool between technical teams and non-technical stakeholders who need to understand the data layout.
Use Cases
ER Diagrams are used in many different situations where data needs to be organized. Software companies use them when building new applications to plan how user data will be stored. Data analysts use them to understand existing systems and find ways to improve them. Students learn to use them in computer science classes to understand the basics of database design. They are also helpful when a business wants to change its current data system, as the diagram shows exactly what needs to be changed. Any project that involves storing and retrieving information can benefit from this planning tool.
Pricing
ER Diagrams are a concept and a design method, so they do not have a price tag. You can create them using free tools like pen and paper or free software available online. Some companies offer paid tools that make drawing these diagrams easier and more professional, but the idea itself is free to use.
Vibes
People who work with databases generally view ER Diagrams as essential. They are seen as a best practice that saves time and prevents costly errors later in a project. Professionals appreciate how they bring clarity to a project that could otherwise be confusing. While some beginners might find the symbols and lines a little tricky at first, most agree that the effort to learn them is worth it for the clarity they provide.
Additional Information
The concept of the Entity Relationship Diagram was created in the 1970s by Peter Chen. It has become a global standard in the field of computer science and information technology. Many universities teach it as a core subject for anyone studying databases. Today, it remains a fundamental skill for database administrators and software engineers everywhere.
This content is either user submitted or generated using AI technology (including, but not limited to, Google Gemini API, Llama, Grok, and Mistral), based on automated research and analysis of public data sources from search engines like DuckDuckGo, Google Search, and SearXNG, and directly from the tool's own website and with minimal to no human editing/review. THEJO AI is not affiliated with or endorsed by the AI tools or services mentioned. This is provided for informational and reference purposes only, is not an endorsement or official advice, and may contain inaccuracies or biases. Please verify details with original sources.
Other Interesting AI Tools


Comments
Please log in to post a comment.